

Amidst today’s fast-paced and highly competitive business environment, it is crucial for investors and industry enthusiasts to conduct comprehensive company evaluations. In this article, we will delve into an extensive industry comparison, evaluating Tesla (NASDAQ:TSLA) in comparison to its major competitors within the Automobiles industry. By analyzing critical financial metrics, market position, and growth potential, our objective is to provide valuable insights for investors and offer a deeper understanding of company’s performance in the industry.
Tesla Background
Tesla is a vertically integrated battery electric vehicle automaker and developer of real-world artificial intelligence software, which includes autonomous driving and humanoid robots. The company has multiple vehicles in its fleet, which include a midsize sedan and crossover SUV in the entry-level luxury category, a luxury light truck, and a semitruck. Tesla also runs a robotaxi service in four US metropolitan areas. Global deliveries in 2025 were nearly 1.64 million vehicles. Additionally, the company sells batteries for stationary storage for residential and commercial properties, including utilities, solar panels, and solar roofs for energy generation. Tesla also owns a fast-charging network and a US auto insurance business.
| Company | P/E | P/B | P/S | ROE | EBITDA (in billions) | Gross Profit (in billions) | Revenue Growth |
|---|---|---|---|---|---|---|---|
| Tesla Inc | 284.67 | 13.98 | 10.49 | 1.31% | $3.03 | $4.75 | 25.52% |
| General Motors Co | 40.31 | 1.28 | 0.46 | 2.06% | $4.82 | $3.66 | 1.92% |
| Ferrari NV | 38.09 | 14.87 | 8.46 | 10.38% | $0.72 | $0.96 | 3.2% |
| Thor Industries Inc | 16.05 | 0.96 | 0.43 | 2.25% | $0.21 | $0.35 | -3.91% |
| Winnebago Industries Inc | 23.61 | 0.74 | 0.32 | 1.17% | $0.04 | $0.09 | -9.86% |
| Average | 29.52 | 4.46 | 2.42 | 3.97% | $1.45 | $1.26 | -2.16% |
By closely examining Tesla, we can identify the following trends:
-
The Price to Earnings ratio of 284.67 for this company is 9.64x above the industry average, indicating a premium valuation associated with the stock.
-
With a Price to Book ratio of 13.98, which is 3.13x the industry average, Tesla might be considered overvalued in terms of its book value, as it is trading at a higher multiple compared to its industry peers.
-
With a relatively high Price to Sales ratio of 10.49, which is 4.33x the industry average, the stock might be considered overvalued based on sales performance.
-
The company has a lower Return on Equity (ROE) of 1.31%, which is 2.66% below the industry average. This indicates potential inefficiency in utilizing equity to generate profits, which could be attributed to various factors.
-
The company exhibits higher Earnings Before Interest, Taxes, Depreciation, and Amortization (EBITDA) of $3.03 Billion, which is 2.09x above the industry average, implying stronger profitability and robust cash flow generation.
-
With higher gross profit of $4.75 Billion, which indicates 3.77x above the industry average, the company demonstrates stronger profitability and higher earnings from its core operations.
-
With a revenue growth of 25.52%, which surpasses the industry average of -2.16%, the company is demonstrating robust sales expansion and gaining market share.
Debt To Equity Ratio
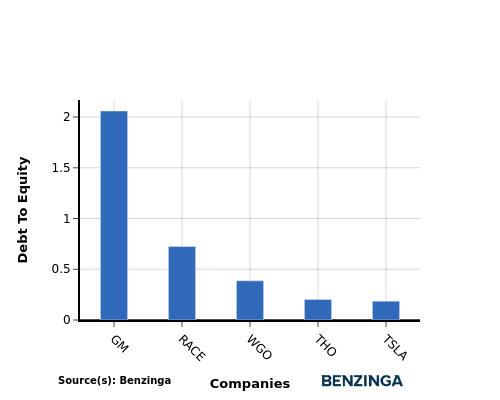
The debt-to-equity (D/E) ratio measures the financial leverage of a company by evaluating its debt relative to its equity.
Considering the debt-to-equity ratio in industry comparisons allows for a concise evaluation of a company’s financial health and risk profile, aiding in informed decision-making.
In terms of the Debt-to-Equity ratio, Tesla can be assessed by comparing it to its top 4 peers, resulting in the following observations:
-
When comparing the debt-to-equity ratio, Tesla is in a stronger financial position compared to its top 4 peers.
-
The company has a lower level of debt relative to its equity, indicating a more favorable balance between the two with a lower debt-to-equity ratio of 0.19.
Key Takeaways
For Tesla, the PE, PB, and PS ratios are all high compared to its peers in the Automobiles industry, indicating that the stock may be overvalued. The low ROE suggests that Tesla is not generating strong returns on shareholder equity. However, the high EBITDA, gross profit, and revenue growth numbers reflect strong operational performance and growth potential within the industry sector.
This article was generated by Benzinga’s automated content engine and reviewed by an editor.