
Amidst today’s fast-paced and highly competitive business environment, it is crucial for investors and industry enthusiasts to conduct comprehensive company evaluations. In this article, we will delve into an extensive industry comparison, evaluating NVIDIA (NASDAQ:NVDA) in comparison to its major competitors within the Semiconductors & Semiconductor Equipment industry. By analyzing critical financial metrics, market position, and growth potential, our objective is to provide valuable insights for investors and offer a deeper understanding of company’s performance in the industry.
NVIDIA Background
Nvidia is a leading developer of graphics processing units. Traditionally, GPUs were used to enhance the experience on computing platforms, most notably in gaming applications on PCs. GPU use cases have since emerged as important semiconductors used in artificial intelligence to run large language models. Nvidia not only offers AI GPUs, but also a software platform, Cuda, used for AI model development and training. Nvidia is also expanding its data center networking solutions, helping to tie GPUs together to handle complex workloads.
| Company | P/E | P/B | P/S | ROE | EBITDA (in billions) | Gross Profit (in billions) | Revenue Growth |
|---|---|---|---|---|---|---|---|
| NVIDIA Corp | 29.48 | 23.86 | 18.58 | 33.06% | $71.0 | $61.16 | 85.23% |
| Broadcom Inc | 60.74 | 19.80 | 23.60 | 11.11% | $13.07 | $15.41 | 47.87% |
| Micron Technology Inc | 25.60 | 12.70 | 14.29 | 32.62% | $35.58 | $35.06 | 345.72% |
| Advanced Micro Devices Inc | 173.86 | 13.19 | 22.87 | 2.17% | $2.4 | $5.42 | 37.85% |
| Texas Instruments Inc | 48.79 | 15.48 | 14.13 | 9.35% | $2.42 | $2.8 | 18.58% |
| Marvell Technology Inc | 91.67 | 12.81 | 26.75 | 0.21% | $0.66 | $1.26 | 27.57% |
| Qualcomm Inc | 20.36 | 7.32 | 4.61 | 29.27% | $2.82 | $5.7 | -3.46% |
| Analog Devices Inc | 57.58 | 5.59 | 14.97 | 3.48% | $1.9 | $2.44 | 37.25% |
| NXP Semiconductors NV | 26.48 | 6.40 | 5.58 | 10.69% | $1.7 | $1.79 | 12.2% |
| Monolithic Power Systems Inc | 94.01 | 17.55 | 21.59 | 5.36% | $0.26 | $0.45 | 26.14% |
| Microchip Technology Inc | 399.68 | 7.41 | 10.17 | 1.79% | $0.39 | $0.8 | 35.11% |
| Credo Technology Group Holding Ltd | 94.82 | 21.51 | 33.55 | 8.64% | $0.17 | $0.3 | 157.02% |
| ON Semiconductor Corp | 66.65 | 4.83 | 6.06 | -0.45% | $0.25 | $0.58 | 4.68% |
| Tower Semiconductor Ltd | 115.70 | 9.43 | 17.55 | 2.2% | $0.15 | $0.11 | 15.48% |
| MACOM Technology Solutions Holdings Inc | 157.10 | 19.87 | 26.05 | 3.34% | $0.07 | $0.16 | 22.5% |
| First Solar Inc | 15.44 | 2.60 | 4.75 | 3.57% | $0.51 | $0.49 | 23.64% |
| Lattice Semiconductor Corp | 988.07 | 25.61 | 33.38 | 3.0% | $0.04 | $0.12 | 42.24% |
| Average | 152.28 | 12.63 | 17.49 | 7.9% | $3.9 | $4.56 | 53.15% |
By conducting an in-depth analysis of NVIDIA, we can identify the following trends:
-
At 29.48, the stock’s Price to Earnings ratio is 0.19x less than the industry average, suggesting favorable growth potential.
-
With a Price to Book ratio of 23.86, which is 1.89x the industry average, NVIDIA might be considered overvalued in terms of its book value, as it is trading at a higher multiple compared to its industry peers.
-
With a relatively high Price to Sales ratio of 18.58, which is 1.06x the industry average, the stock might be considered overvalued based on sales performance.
-
The Return on Equity (ROE) of 33.06% is 25.16% above the industry average, highlighting efficient use of equity to generate profits.
-
Compared to its industry, the company has higher Earnings Before Interest, Taxes, Depreciation, and Amortization (EBITDA) of $71.0 Billion, which is 18.21x above the industry average, indicating stronger profitability and robust cash flow generation.
-
With higher gross profit of $61.16 Billion, which indicates 13.41x above the industry average, the company demonstrates stronger profitability and higher earnings from its core operations.
-
The company is experiencing remarkable revenue growth, with a rate of 85.23%, outperforming the industry average of 53.15%.
Debt To Equity Ratio
The debt-to-equity (D/E) ratio is a financial metric that helps determine the level of financial risk associated with a company’s capital structure.
Considering the debt-to-equity ratio in industry comparisons allows for a concise evaluation of a company’s financial health and risk profile, aiding in informed decision-making.
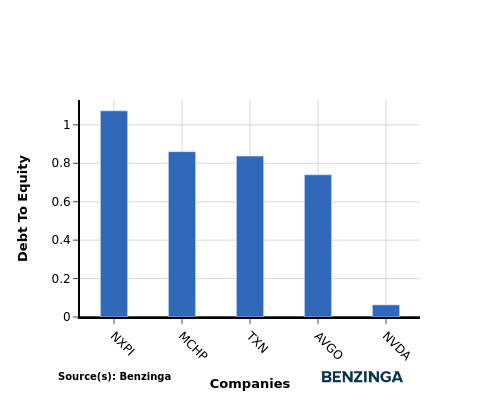
In light of the Debt-to-Equity ratio, a comparison between NVIDIA and its top 4 peers reveals the following information:
-
In terms of the debt-to-equity ratio, NVIDIA has a lower level of debt compared to its top 4 peers, indicating a stronger financial position.
-
This implies that the company relies less on debt financing and has a more favorable balance between debt and equity with a lower debt-to-equity ratio of 0.06.
Key Takeaways
For NVIDIA, the PE ratio is low compared to peers, indicating potential undervaluation. The high PB and PS ratios suggest strong market sentiment and premium valuation. In terms of ROE, EBITDA, gross profit, and revenue growth, NVIDIA outperforms its industry peers, reflecting robust financial performance and growth prospects.
This article was generated by Benzinga’s automated content engine and reviewed by an editor.