

In the dynamic and cutthroat world of business, conducting thorough company analysis is essential for investors and industry experts. In this article, we will undertake a comprehensive industry comparison, evaluating Amazon.com (NASDAQ:AMZN) and its primary competitors in the Broadline Retail industry. By closely examining key financial metrics, market position, and growth prospects, our aim is to provide valuable insights for investors and shed light on company’s performance within the industry.
Amazon.com Background
Amazon is the leading online retailer and marketplace for third party sellers. Retail related revenue represents approximately 74% of total, followed by Amazon Web Services (17%), and advertising services (9%). International segments constitute 22% of Amazon’s total revenue, led by Germany, the United Kingdom, and Japan.
| Company | P/E | P/B | P/S | ROE | EBITDA (in billions) | Gross Profit (in billions) | Revenue Growth |
|---|---|---|---|---|---|---|---|
| Amazon.com Inc | 22.32 | 5.42 | 3.89 | 12.61% | $102.16 | $104.83 | 19.62% |
| MercadoLibre Inc | 49.84 | 13.15 | 3.01 | 5.94% | $0.89 | $3.86 | 49.03% |
| eBay Inc | 25.31 | 11.03 | 4.38 | 11.34% | $0.77 | $2.29 | 19.5% |
| Dillard’s Inc | 14.69 | 4.77 | 1.46 | 13.17% | $0.27 | $0.72 | 2.69% |
| Global E Online Ltd | 61.99 | 7.65 | 7.18 | 3.29% | $0.04 | $0.11 | 32.76% |
| Macy’s Inc | 10.83 | 1.43 | 0.32 | 1.3% | $0.33 | $2.03 | 2.07% |
| Ollie’s Bargain Outlet Holdings Inc | 19.08 | 2.47 | 1.74 | 2.99% | $0.09 | $0.28 | 14.25% |
| Kohl’s Corp | 8.45 | 0.57 | 0.15 | -0.35% | $0.22 | $1.36 | -2.04% |
| Savers Value Village Inc | 76.64 | 3.84 | 1.01 | -1.22% | $0.03 | $0.22 | 8.93% |
| Hour Loop Inc | 37.40 | 8.42 | 0.45 | 11.12% | $0.0 | $0.02 | 15.84% |
| Average | 33.8 | 5.93 | 2.19 | 5.29% | $0.29 | $1.21 | 15.89% |
Upon closer analysis of Amazon.com, the following trends become apparent:
-
The stock’s Price to Earnings ratio of 22.32 is lower than the industry average by 0.66x, suggesting potential value in the eyes of market participants.
-
The current Price to Book ratio of 5.42, which is 0.91x the industry average, is substantially lower than the industry average, indicating potential undervaluation.
-
The Price to Sales ratio of 3.89, which is 1.78x the industry average, suggests the stock could potentially be overvalued in relation to its sales performance compared to its peers.
-
With a Return on Equity (ROE) of 12.61% that is 7.32% above the industry average, it appears that the company exhibits efficient use of equity to generate profits.
-
The Earnings Before Interest, Taxes, Depreciation, and Amortization (EBITDA) of $102.16 Billion is 352.28x above the industry average, highlighting stronger profitability and robust cash flow generation.
-
With higher gross profit of $104.83 Billion, which indicates 86.64x above the industry average, the company demonstrates stronger profitability and higher earnings from its core operations.
-
The company is experiencing remarkable revenue growth, with a rate of 19.62%, outperforming the industry average of 15.89%.
Debt To Equity Ratio
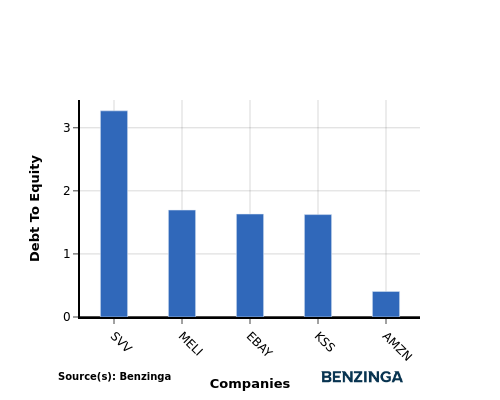
The debt-to-equity (D/E) ratio indicates the proportion of debt and equity used by a company to finance its assets and operations.
Considering the debt-to-equity ratio in industry comparisons allows for a concise evaluation of a company’s financial health and risk profile, aiding in informed decision-making.
When examining Amazon.com in comparison to its top 4 peers with respect to the Debt-to-Equity ratio, the following information becomes apparent:
-
Amazon.com is in a relatively stronger financial position compared to its top 4 peers, as evidenced by its lower debt-to-equity ratio of 0.4.
-
This implies that the company relies less on debt financing and has a more favorable balance between debt and equity.
Key Takeaways
For Amazon.com in the Broadline Retail industry, the PE and PB ratios suggest the stock is undervalued compared to peers. However, the high PS ratio indicates the stock may be overvalued based on revenue. In terms of profitability, Amazon.com shows strong performance with high ROE, EBITDA, and gross profit margins. Additionally, the company’s high revenue growth rate further highlights its competitive position within the industry.
This article was generated by Benzinga’s automated content engine and reviewed by an editor.